Navigating Health Care Valuation EBITDA Multiple Ranges for Fair Market Value

Health Care Valuation Services

Health Care Valuation Services
Never miss a thing.
Sign up to receive our insights newsletter.

Dispersion of Multiples within the Range Varies Widely by Segment
Many business valuations begin with calculating a multiple of EBITDA (earnings before interest, taxes, depreciation, and amortization). In health care, however, valuators should deliberate just when and how to apply general valuation EBITDA transaction multiples for fair market value opinions. Rather than just applying median or mean multiples derived from a historical data set for the industry segment, valuators must recognize that data set dispersion within an applicable range varies widely by segment.
Why It Matters
- Understanding the range and data dispersion of EBITDA transaction multiples is crucial to developing a supportable fair market value opinion. The wider the range (difference between minimum and maximum values) and higher the dispersion (variation of data point distribution), the less likely that a pure application of industry mean or median EBITDA transaction multiples is appropriate or supportable (all else being equal).
- EBITDA multiple ranges and dispersion are higher in some health care segments (e.g., Home Health and Hospice) and lower in others (e.g., Dialysis).
- Differences in valuation multiple ranges and dispersion are caused by many factors, such as the number of active buyers, the efficiency of the transaction market and the homogeneity of enterprise characteristics (size, profitability, growth, market positioning, etc.).
For Example:
A graph makes it easy to see data ranges and dispersion by health care segment. The chart below is based on publicly available EBITDA transaction multiples between January 2016 and September 2021. The data is presented visually via a box and whisker plot, which displays the median (horizontal line inside the box), lower and upper quartiles (top and bottom lines of the box), and lower and upper extremes of the data (the “whisker” lines).
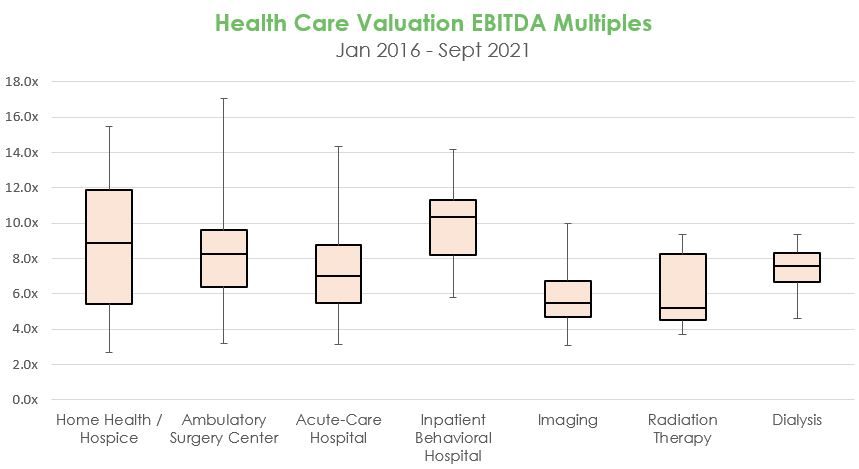
Source: Weaver analysis of Scope Research database.
As illustrated above, material differences exist in historical dispersion and range by segment:
- Some segments, such as Dialysis and Imaging, have displayed multiples with a low dispersion around the median (i.e., lower and upper quartile ranges are closer) and a narrower range (i.e. less extreme lower and upper bounds).
- Other segments, like Ambulatory Surgery Centers, have displayed a moderate multiple dispersion around the median but a much wider range.
- A few segments, notably Home Health and Hospice, have displayed both extremely high dispersion around the median and a wide multiple range.
Health Care Valuation Takeaways
- Health care owners and investors should consult with their valuation professionals to determine whether they are observing caution when using the market approach and applying multiples to company data.
- Blindly utilizing the median of a data set in the context of the market approach to value is not always appropriate. There is a risk of a large valuation error when using data subsets with varying dispersion and ranges.
- Within any health care segment, the valuator should investigate EBITDA transaction multiple data dispersions and ranges to understand the primary factors driving differences (e.g. size, growth, profitability). Factor adjustments to the median can be utilized to ensure a more supportable fair market value opinion.
Dig Deeper
© 2021
This is one in a series of related health care valuation posts:
- Urgent Care Centers Embrace a Once in a Generation Business Opportunity
- Closing the Gap Between Perceived and Actual Demand in Behavioral Health
- The Importance of a Stable Payer Mix to a Premium Valuation
- After the Pandemic, What Are the Long-Term Valuation Implications for Long Term Acute Care Hospitals?
- Hospice Valuations in a High Multiple Comparable Sales Environment
- Guarding the Shelf Life of Fair Market Value Opinions for Management Services Organizations
- Managed Care Companies Predicting the “Worst of Two Worlds”
- Navigating Urgent Care Valuations in Unusual Times
- ASC Partnerships Face Succession Challenges
