Valuation Patterns in ASC and Imaging Center Transactions

Health Care Valuation Services
Never miss a thing.
Sign up to receive our insights newsletter.

Ambulatory surgery centers (ASCs) and imaging centers continue to draw strong interest from investors and strategic buyers, but determining what these businesses are worth isn’t always straightforward. Valuation multiples, which reflect how much a buyer is willing to pay relative to a company’s earnings, offer one way to assess pricing trends across the market.
Valuation multiples observed in ASCs and imaging centers tend to exhibit more predictability relative to other health care segments. ASC valuation multiples in particular appear to be normally distributed around the median. On the other hand, imaging center valuation multiples cluster in groups above and below the median. However, the majority of observed transactions occurred at valuation multiples below the median. In today’s fluctuating market, understanding the underlying characteristics of transaction databases is critical for health care leaders, investors and valuation professionals to make better-informed pricing decisions.
By the Numbers
Publicly available transaction data from 2010 to 2024 offers insight into how valuation multiples have trended for ASCs and imaging centers over time. While there are a multitude of factors that impact valuations (e.g., outlook, capital expenditures, etc.), our analysis focused on EBITDA multiples.
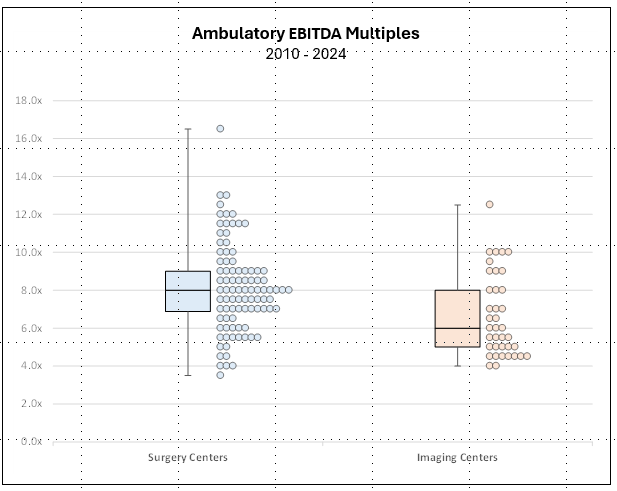
The EBITDA multiples presented in the box and whisker and scatterplot chart shown below display the median (horizontal line inside the box), lower and upper quartiles (top and bottom lines in the box) and minimum and maximum extremes of the data (the lines coming out of the box). The corresponding circles represent individual transaction data points.
Source: Author analysis of Scope Research’s database.
ASCs — Transaction Database Observations
- The median EBITDA multiple is approximately 8x and represents the most frequently observed multiple in transaction data. The pattern of individual data points surrounding the median appears normally distributed.
- The interquartile distribution range of ASC multiples is tight, further suggesting uniformity and consistency in valuation across the sample of transactions.
- Overall, the data indicates ASC valuation multiples are relatively stable and predictable, reflecting standardization in operational performance, market conditions and investor expectations. All else equal, such observations allow for more straightforward valuation benchmarking, aiding investors and stakeholders in making informed pricing decisions.
Imaging Centers — Transaction Database Observations
- The distribution of valuation multiples is skewed into distinct groupings above and below the median. Overall, there are more transactions clustering below the median EBITDA multiple of 6x than above. The most common EBITDA multiple for imaging centers is approximately 4.2x, which lies outside the interquartile range, further indicating a skewed distribution.
- Some imaging centers have transacted at valuation multiples well above the median. In these cases, individual characteristics (e.g., size, growth, equipment condition, sustainability, etc.) matter.
- The skewed distribution in imaging center valuation multiples indicates greater potential for pricing risk, requiring more nuanced analysis of individual characteristics.
Market Commentary Supports the Data
While no database can adequately capture all transactions in an industry due to the limits on availability of information, market participants have validated the previously outlined observations for ASC and imaging center valuations:
ASCs: Market commentary
“Our record of successfully executing intentional, disciplined acquisitions gives us confidence that we can continue to generate the same level of margin expansion. For example, the average multiple on acquisitions completed in the period from 2021 through 2023 was less than 8x adjusted EBITDA.”
Eric Evans, CEO of Surgery Partners Inc., Q4 2024 earnings call transcript
Imaging centers: Market commentary
“But typically, we’ll spend anywhere between 4 and 6, 4 and 7x EBITDA for a small tuck-in transaction in our market … for midsized transactions, we might stretch beyond that multiple level for something that’s very strategic, that there’s scarcity value, that’s important to the network in that regional marketplace.”
Mark Stopler, EVP and CFO of RadNet, Inc., company presentation on September 5, 2024
Health Care Valuation Takeaways
Health care valuation professionals must thoroughly understand and analyze any transaction database to use the information accurately. Relying solely on the median values of a data set can lead to inaccurate conclusions, especially if the database exhibits varying levels of dispersion and range. For ASCs, transaction databases are reliable for benchmarking without adjustment due to the tight and normal distribution of the data. However, when valuing an imaging center, the unique characteristics of the subject company are more critical, given the skewed nature of the information within the transaction database.
Within any health care segment, the valuator should also examine the broader data set to understand what is driving variations in multiples. Factors such as size, growth trajectory and profitability can influence value. Appropriate factor adjustments can ensure a more supportable fair market value opinion.
Navigating ASC or imaging center valuations with clarity is essential for making well-informed decisions in today’s dynamic health care market. For guidance on ASC and imaging transactions and valuations, contact us. Our professionals can help you make strategic choices that move your organization forward.
©2025
